Four-Wheel Counterbalance Electric Forklift Load Chart Interpretation: Derating Capacity Across Lift Height and Attachment Use
News 31/10/2026
A load chart on a four-wheel counterbalance electric forklift answers one question: how much can this truck safely lift at a given lift height, load center, and attachment configuration? The rated capacity printed on the data plate applies only to a specific combination of those conditions. Raise the load, move its center of gravity forward, or bolt on a clamp, and the safe capacity drops. Reading the chart correctly is the difference between a productive shift and a stability incident. This guide explains how to read the chart, why capacity derates, and which figures to verify with the manufacturer before you buy or deploy a counterbalance forklift.
How a Counterbalance Load Chart Works
A load chart is a graphical or tabular statement of residual capacity. It typically plots rated capacity against load center distance and lift height, sometimes adding a separate curve or table for each approved attachment. The data plate gives the rated capacity at a defined load center, commonly 500 mm or 600 mm, with the mast vertical and a standard fork carriage. Everything else on the chart is a reduction from that baseline.
Three variables drive the numbers:
- Load center: the horizontal distance from the vertical face of the forks to the load’s center of gravity. A longer load, a pallet loaded unevenly, or an attachment that pushes the load forward all increase this distance.
- Lift height: as the carriage rises, the load’s moment arm about the front axle grows, and the truck’s stability margin shrinks.
- Attachment: any device between the carriage and the load adds its own weight and usually moves the load forward, consuming capacity twice over.
The chart is a stability document, not a marketing document. Treat the lowest number that applies to your actual combination as the working limit.
Derating Across Lift Height, Load Center, and Attachments
Why capacity falls as the load rises
A counterbalance truck stays upright because its counterweight and chassis mass oppose the tipping moment created by the load. That moment equals load weight multiplied by the horizontal distance from the front axle to the load center. Raising the load does not change its weight, but it changes the geometry of the combination and reduces the margin the manufacturer designed in. Charts therefore show a capacity line that steps down at defined heights. If your task requires lifting to a height beyond the chart’s highest plotted point, the truck is not rated to do it, regardless of what the load weighs.
In practice, a pallet that is comfortably within capacity at floor level may exceed the limit at the top racking beam. Operators who only check the data plate miss this. Post the chart at the point of use and mark the maximum height your fleet is permitted to work at with each load class.
Load center: the most common misread
Load center is where most derating errors begin. A standard pallet loaded to its footprint has a predictable center. A long crate, a double-deep pallet, or a load that shifts during transport does not. When the actual load center exceeds the rated figure, capacity must be reduced in line with the chart, and if the chart does not extend to that distance, the manufacturer must be consulted.
Practical checks include measuring the load, confirming the pallet is loaded symmetrically, and verifying that the fork length supports the load without excessive overhang. Overhang beyond the fork tips effectively lengthens the load center and is a frequent cause of instability that has nothing to do with the truck’s nominal rating.
Attachments: subtract the device, then subtract again
Attachments such as clamps, rotators, or sideshifters change the calculation in two ways. First, the attachment has mass, and that mass sits forward of the carriage, so it reduces available capacity even with no load. Second, the attachment moves the load forward, increasing the effective load center. Manufacturers publish a derated capacity rating specific to each approved attachment; that figure, not the base rating, governs operation.
Two rules follow. Use only attachments the manufacturer has rated for your truck model, and use the attachment-specific chart. A capacity figure quoted without reference to the attachment is not a usable number.
A worked comparison without invented numbers
Because residual capacity depends on the specific model and its published chart, this article does not quote capacity values. The method is what matters: start from the rated capacity at the standard load center, find the row or curve matching your lift height, then apply the attachment derating. Compare the resulting number with the heaviest load you actually handle, including pallet weight. If any input is uncertain, the answer is to verify with the supplier rather than estimate.
Applying the Chart in a Warehouse or Loading Operation
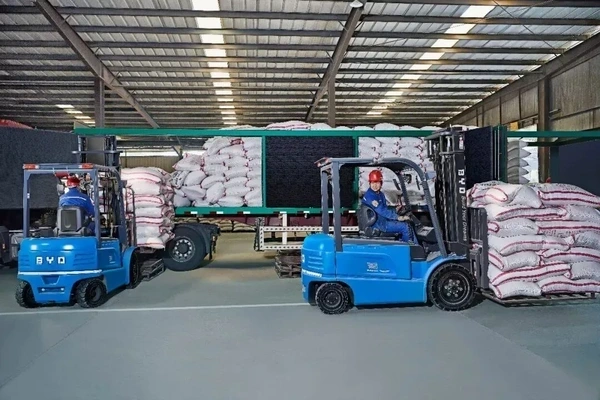
The following is a hypothetical application scenario, not a report of a specific site. A distribution warehouse stores palletized goods on selective racking and loads road vehicles from a dock. The fleet consists of four-wheel counterbalance electric forklifts, the configuration this site supplies. The operation must decide whether the same truck can serve both the top racking level and dock loading.
Start with the task data: heaviest unit load including pallet, the highest lift height required, the load center of the pallets actually used, and any attachment needed. Then compare each task against the chart. It is common to find that dock work is within capacity while the top racking level is not, or that a clamp attachment reduces capacity below the heaviest load. In that case the options are to reorganize storage so heavy loads stay low, to dedicate a higher-capacity truck to the tall bays, or to confirm with the manufacturer whether a different configuration is rated for the duty.
Operating conditions also affect the margin. Uneven floors, ramps, strong wind at open dock doors, and wet surfaces all reduce the stability reserve. A chart assumes defined operating conditions; a truck working at the edge of its capacity on a slope is outside that assumption. Keep travel speeds low with elevated loads and keep the load as close to the ground as the task allows.
| Parameter or condition | Why the operation cares | What to confirm with the supplier | Standard or optional |
|---|---|---|---|
| Rated capacity at stated load center | Baseline figure on the data plate | Load center distance the rating assumes; whether a chart is supplied | Standard |
| Capacity at maximum lift height | Top racking level may exceed the limit | Chart values at each lift height used on site | Standard documentation |
| Attachment-specific derating | Clamps and rotators consume capacity | Approved attachment list and its capacity rating | Optional, model-dependent |
| Battery and charging arrangement | Shift length and charging windows affect availability | Charging profile, opportunity charging guidance, battery options | Configuration-dependent |
| Floor, ramp, and aisle conditions | Reduce stability margin and affect turning | Turning radius, aisle width guidance, slope limits | Site data, verify against model data |
Common errors to eliminate
- Using the data plate rating as the limit at every height.
- Ignoring pallet weight and load shift when calculating the unit load.
- Fitting an unapproved attachment and continuing to use the base rating.
- Assuming a chart value transfers between truck models or battery configurations.
- Lifting a load that is within capacity but positioned with excessive overhang.
What to prepare before requesting a selection
Bring the actual duty data: heaviest load including pallet, required lift height, load center, attachment requirement, aisle width, floor and ramp conditions, shift pattern, and charging arrangements. With those inputs, the supplier can match a four-wheel counterbalance electric forklift configuration to the task and provide the correct load chart. Without them, any recommendation is guesswork.
Frequently Asked Questions
Does the capacity on the data plate apply at full lift height?
No. The data plate rating applies at a specified load center and usually with the mast in a defined position. The load chart shows how capacity reduces as lift height and load center increase. Always use the chart value that matches your actual task.
Can I use an attachment and keep the original rated capacity?
Generally not. An attachment adds weight forward of the carriage and moves the load forward, so the manufacturer publishes a derated capacity specific to that attachment. Use the attachment-specific rating, and confirm that the attachment is approved for your truck model.
What if my load center is longer than the chart covers?
Do not estimate. If the chart does not extend to your load center, or your lift height exceeds its range, contact the manufacturer or supplier for guidance. Operating beyond the chart’s range takes the truck outside its documented stability limits.
Do floor conditions change the chart figures?
The chart assumes defined operating conditions. Uneven surfaces, ramps, and wet floors reduce stability margin, so a truck working near its capacity limit on such surfaces is not operating within the chart’s assumptions. Keep loads low, reduce speed, and confirm site conditions against the model’s published guidance.
How do I confirm the right configuration before purchase?
Provide the heaviest unit load, highest lift height, load center, attachment needs, aisle and floor conditions, and charging arrangements. Ask the supplier to supply the load chart and attachment ratings that match those inputs, and check that every task on site falls within the documented limits.